Why The Chicken Crossed The Road: A Response To Rex Evans
Re. Rex’s Substack: Why did the chicken cross the road?
(All the code is available on my Github, here.)
So I’ve been thinking about this a lot.
In Option 2, you maintain the option to cross the avenue at any light before 45th. So, if you get stopped at a light as you are walking down towards 45th, you can always cross the avenue then and don’t have to wait.
The argument you’re making here is that it would be better to stay on your side, because you can cross the street now and reserve the option to cross the avenue when the street crossing is no longer available. You noted the assumption that “crossing avenues takes longer than crossing numbered streets”, but that’s just a function of the size of avenues vs. streets. If avenues were the exact same size, this matters less.
There’s also the problem of how many streets and avenues you need to still cross. You address the case of when you’re just 1 intersection away, in which case the difference is negligible, but I wonder how this works when you’re further away vs. when you’re closing in on the target.
Now, not to get carried away, but cities are complicated places. New York, at least, is mostly uniform in its layout, but even still has some variation. There’s no guarantee that each city street or avenue will be the same size as the others, nor that blocks are evenly spaced. There are some intersections that have less than 4 crosswalks. Given all this variation, it would be hard to simulate an accurate city. Most cities aren’t even a grid. So maybe we should simplify the scope a bit and imagine the ideal city. Let’s call it Chickenville, staying in the theme of your Substack post.
Chickenville is the ideal city
You’ll be thrilled to hear that Chickenville is a mathematically ideal city. All of its streets are the same height, all of its avenues the same width, and all the blocks are evenly spaced. The city is rectangular, where the south-west corner marks the intersection of 1st street and 1st avenue. The streets continue northward, incrementing 1, 2, 3, 4 til infinity. And the avenues continue eastward, incrementing 1, 2, 3, 4 til infinity.
Now we can simulate the city. We want to define the start and end locations. In this case, the location is described as a 3-tuple:
(street, avenue, corner), where street is the street number, avenue is the avenue name, and corner is one of “northeast”, “northwest”, “southeast”, “southwest”.
(I guess we’re ignoring all restaurants and bars that are not at corners of intersections? Geez, that cuts out a lot of good ones…)
We can then note the following variables:
- street block length
- street crosswalk length
- avenue block length
- avenue crosswalk length
- walker speed
- street traffic light cycle time (green time, red time)
- avenue traffic light cycle time (green time, red time)
We assume the walker is going at a constant speed and that they can only walk along sidewalks and crosswalks. This becomes an exercise of counting costs, where the “cost” of a path is the time taken, including both time spent walking and time spent waiting for traffic lights.
Let’s do a quick example:
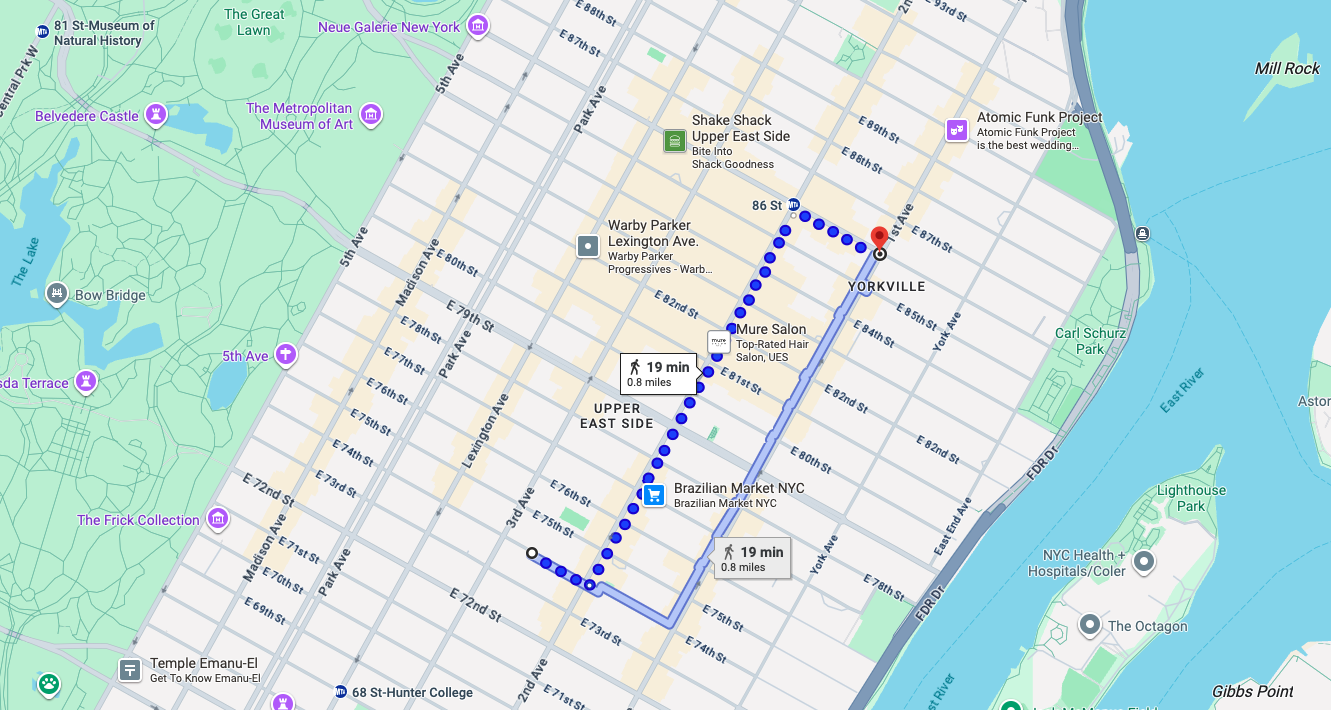
To go from the southwest corner of 86th st and 1st ave to the northeast corner of 74th str and 3rd ave, we need to cross:
- 12 street blocks
- 11 street crosswalks
- 2 avenue blocks
- 1 avenue crosswalk
Without traffic lights, given the following parameters (in meters and seconds):
- street block length = 15m
- street crosswalk length = 3m
- avenue block length = 30m
- avenue crosswalk length = 5m
- walker speed = 1 m/s
it would be:
(12 * 15) + (11 * 3) + (2 * 30) + 5 = 278 seconds or 4.63 minutes
This would be our “cost” no matter whether we decide to cut straight south until we hit 74th then cut west, or whether we zigzag, or whatever.
This, I argue, is the basis for our simulation: cost. We’re essentially just adding line segment distances here.
How do we properly model the traffic light? With nothing less than some good ol’ statistics!
Some good ol’ statistics!
We firstly assume that all street traffic lights have identical light cycle times, and likewise for all avenue traffic lights. They may or may not be aligned with each other, but 1st avenue’s red won’t be shorter than 2nd or 3rd’s. We’ll assume for now that the “initial green” on each traffic light is unknown, and that each cycle is independent.
We can model each crosswalk as being associated with a random variable, which is the time in seconds the walker must wait at the red before the green shows. We’ll assume that once the green shows, the walker can successfully cross the crosswalk, even if the light cycle is shorter than the time it takes for the walker to clear the distance. (Yeesh, have some mercy cars.)
Let’s take an example light cycle to cross an avenue: (green = 10s, red = 15s).
This means that, to cross the street perpendicular to the avenue, the light cycle would be inverted: (green = 15s, red = 10s).
Let’s analyze the time it takes to cros the avenue. Upfront, the probability of arriving at the light when it’s green is 10 / (10 + 15) = 0.4 or 40%. However, the other 60% of the time, we don’t necessarily incur the maximum cost of 15s of waiting, but rather we might have to wait 10s, or only 4s, depending when in the cycle we show up. So we can treat this like a uniform distribution between 0-15, where in the mean, you’ll have to wait 15/2 = 7.5s. This is the expected wait time given we show up to a red light. Now, to integrate both of these facts into a single cost, we can combine the cost of either hitting a green, or given a red, the cost of uniformly sampling it.
It would be the weighted probability of both events: so 0.4 * 0s + 0.6 * 7.5s = 4.5s.
It would be similar, but opposite for analyzing the cost of crossing the street. The probability of hitting the green is 15 / (10 + 15) = 0.6 or 60%. The probability of hitting the red is 1 - P(green) = 1 - 0.6 = 0.4 = 40%. The expected wait time given we show up at a red light is 10 / 2 = 5s.
So taking the weighted probabilities, we get: 0.6 * 0s + 0.4 * 5s = 2s.
This is in the limit case, but if you have knowledge of if the upcoming traffic light next green time, it would not be the same cost. Now, using just this naive “expected value” of the wait time, let’s calculate what path we should take.
- 12 street blocks * 15m street block length
- (11 street crosswalks * 3m street crosswalk length) + (11 street crosswalks * 2s expected wait time per street)
- 2 avenue blocks * 30m avenue block length
- (1 avenue crosswalk * 5m avenue crosswalk length) + (1 avenue crosswalk * 4.5s expected wait time per avenue)
(12 * 15) + (11 * 3) + (11 * 2) + (2 * 30) + (1 * 5) + (1 * 4.5) = 304.5s!
I’m sure you noticed that this number is the same regardless of the path. The only way we can really take into account the best path is to simulate the traffic lights. Instead of taking the expected value, we should actually uniformly sample the red light waiting time, and run this simulation enough times to get a significant result.
Enough theory. Let’s do the simulation.
Let’s take a walk around Chickenville
Chickenville is gorgeous this time of year! So you decide to go with your best friend to meet at the bar. You meet up at 1st and 1st, on the South-West corner, which is the south-west-est point in all of Chickenville. The bar is on 5th street and 6th avenue, on the North-West corner. You, in dire need of a drink after this week’s layoffs at the firm, decide that the “street” policy is the best way to the bar: if you see a green light to cross the avenue, you damn well better take it.
Your friend disagrees, and instead argues for an “avenue” policy, where you should prefer to walk north along 1st avenue until you hit a red light or until you hit 5th street, and then turn east. He argues that you should “preserve” your option to turn east until you really need to use it. It sounds like blasphemy - don’t take the green light to cross the avenue? How could that possibly be a better option?
You both decide to run an experiment, whereby you will race! But there’s a catch - the race will be conducted 2,430 times, in different circumstances, where the Chickenville City Council has agreed to contribute to your experiment by changing the city’s configuration.
The City Council will allow you to run races in each of the following configurations:
- Street Block Length: (200m, 500m, 800m)
- Avenue Block Length: (200m, 500m, 800m)
- Street Crosswalk Length: (10m, 30m, 50m)
- Avenue Crosswalk Length: (10m, 30m, 50m)
- Avenue Traffic Cycle Times, denoted as (green seconds, red seconds): (10s, 15s), (15s, 10s), (25s, 30s), (30s, 25s), (50s, 55s), (55s, 50s)
In order to ensure the experiment is conducted evenly, they allow you to race 5 times in each given configuration, so as to even out the randomness of the traffic light time.
Let’s check that these line up - multiplying the number of configurations we’re trying for each parameter, we get:
3 * 3 * 3 * 3 * 6 * 5 = 2,430
And… we’re off to the races!
The Chickenville race
Here’s one that shows a clear difference. In this case, the street policy finished in ~56.55s, and the avenue policy scored a low ~44.38s! More than a 10s lead for staying along the avenue!
Your friend is the blue walker with the “avenue” policy, and you are the red walker, preferring the “street” policy.
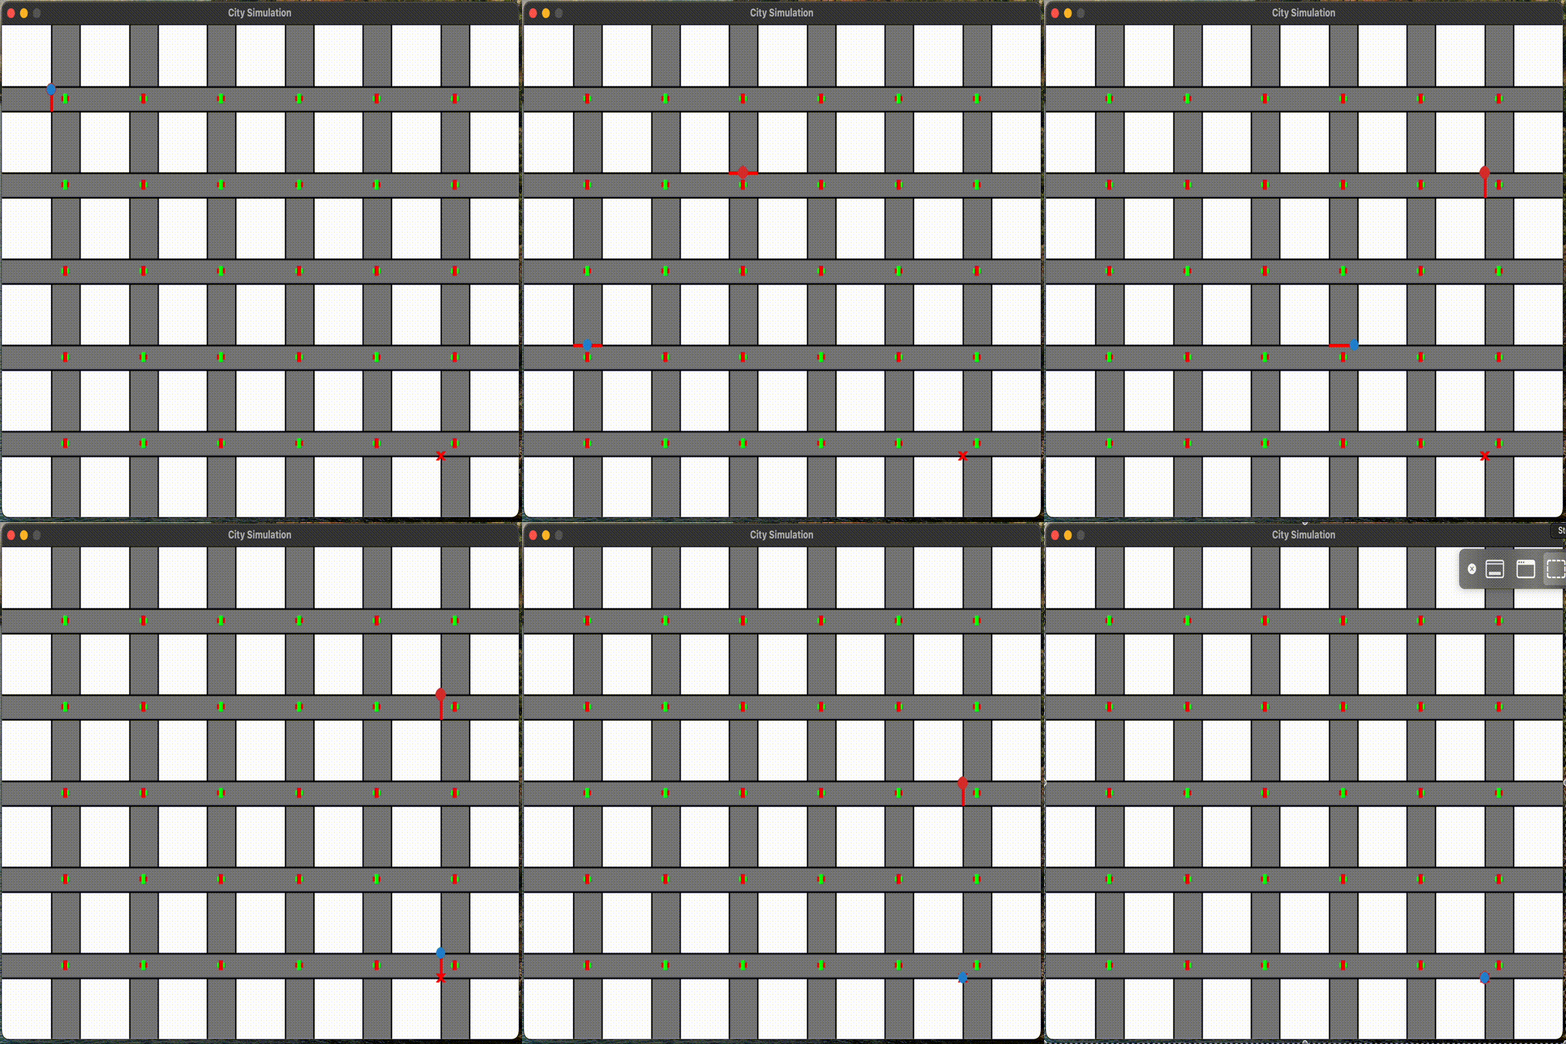
In this case, the avenue policy (blue) won. But this is just one run that had a significant difference - to see the trend, we’ll want to repeat the experiment many times. Well, 2,430 times to be exact!
The results are in!
The experiment was run, so let’s take a look at the breakdown by policy:
| street_policy | avenue_policy | green_time | red_time | |
|---|---|---|---|---|
| count | 2,430 | 2,430 | 2,430 | 2,430 |
| mean | 229.67 | 234.60 | 30.83 | 30.83 |
| std | 68.83 | 71.38 | 16.69 | 16.69 |
| min | 66.80 | 66.80 | 10.00 | 10.00 |
| 25% | 178.78 | 179.69 | 15.00 | 15.00 |
| 50% | 256.80 | 262.82 | 27.50 | 27.50 |
| 75% | 269.45 | 280.63 | 50.00 | 50.00 |
| max | 410.92 | 410.92 | 55.00 | 55.00 |
Looks like the street policy won! On average, it took 229.67s, as opposed to the 234.6s for the avenue policy - a difference of about 2%.
Conclusion
This simulation probably missed some key factors, so it’s not conclusive. But from the results, the “street” policy is actually the more promising one. So next time you’re racing to the bar, you should prefer to cross the avenue first if the avenue light is green, rather than “preserving” your option to cross by forgoing the green light.
Cheers!